
Dr Solstad received the Data Journalist of the Year prize at the 2024 Press Awards for his reporting on the Russian invasion of Ukraine that cleverly repurposes a satellite data designed to track forest fires in order to map and report on war developments in real time. His war tracker has now been used to cover the Sudanese Civil War, monitor rockets fired between Israel and Gaza, and examine air bases in China. Dr Solstad also won the 2022 Future of Media Awards for his work on uncovering the true pandemic death toll, which researchers at the NYU Langone, an academic health center affiliated with New York University, later validated as predictive. His work has been cited in academic publications and press outlets alike, and he has given talks to international organisations including the World Health Organisation and the United Nations Secretary-General’s Office.
Developing Data Stories
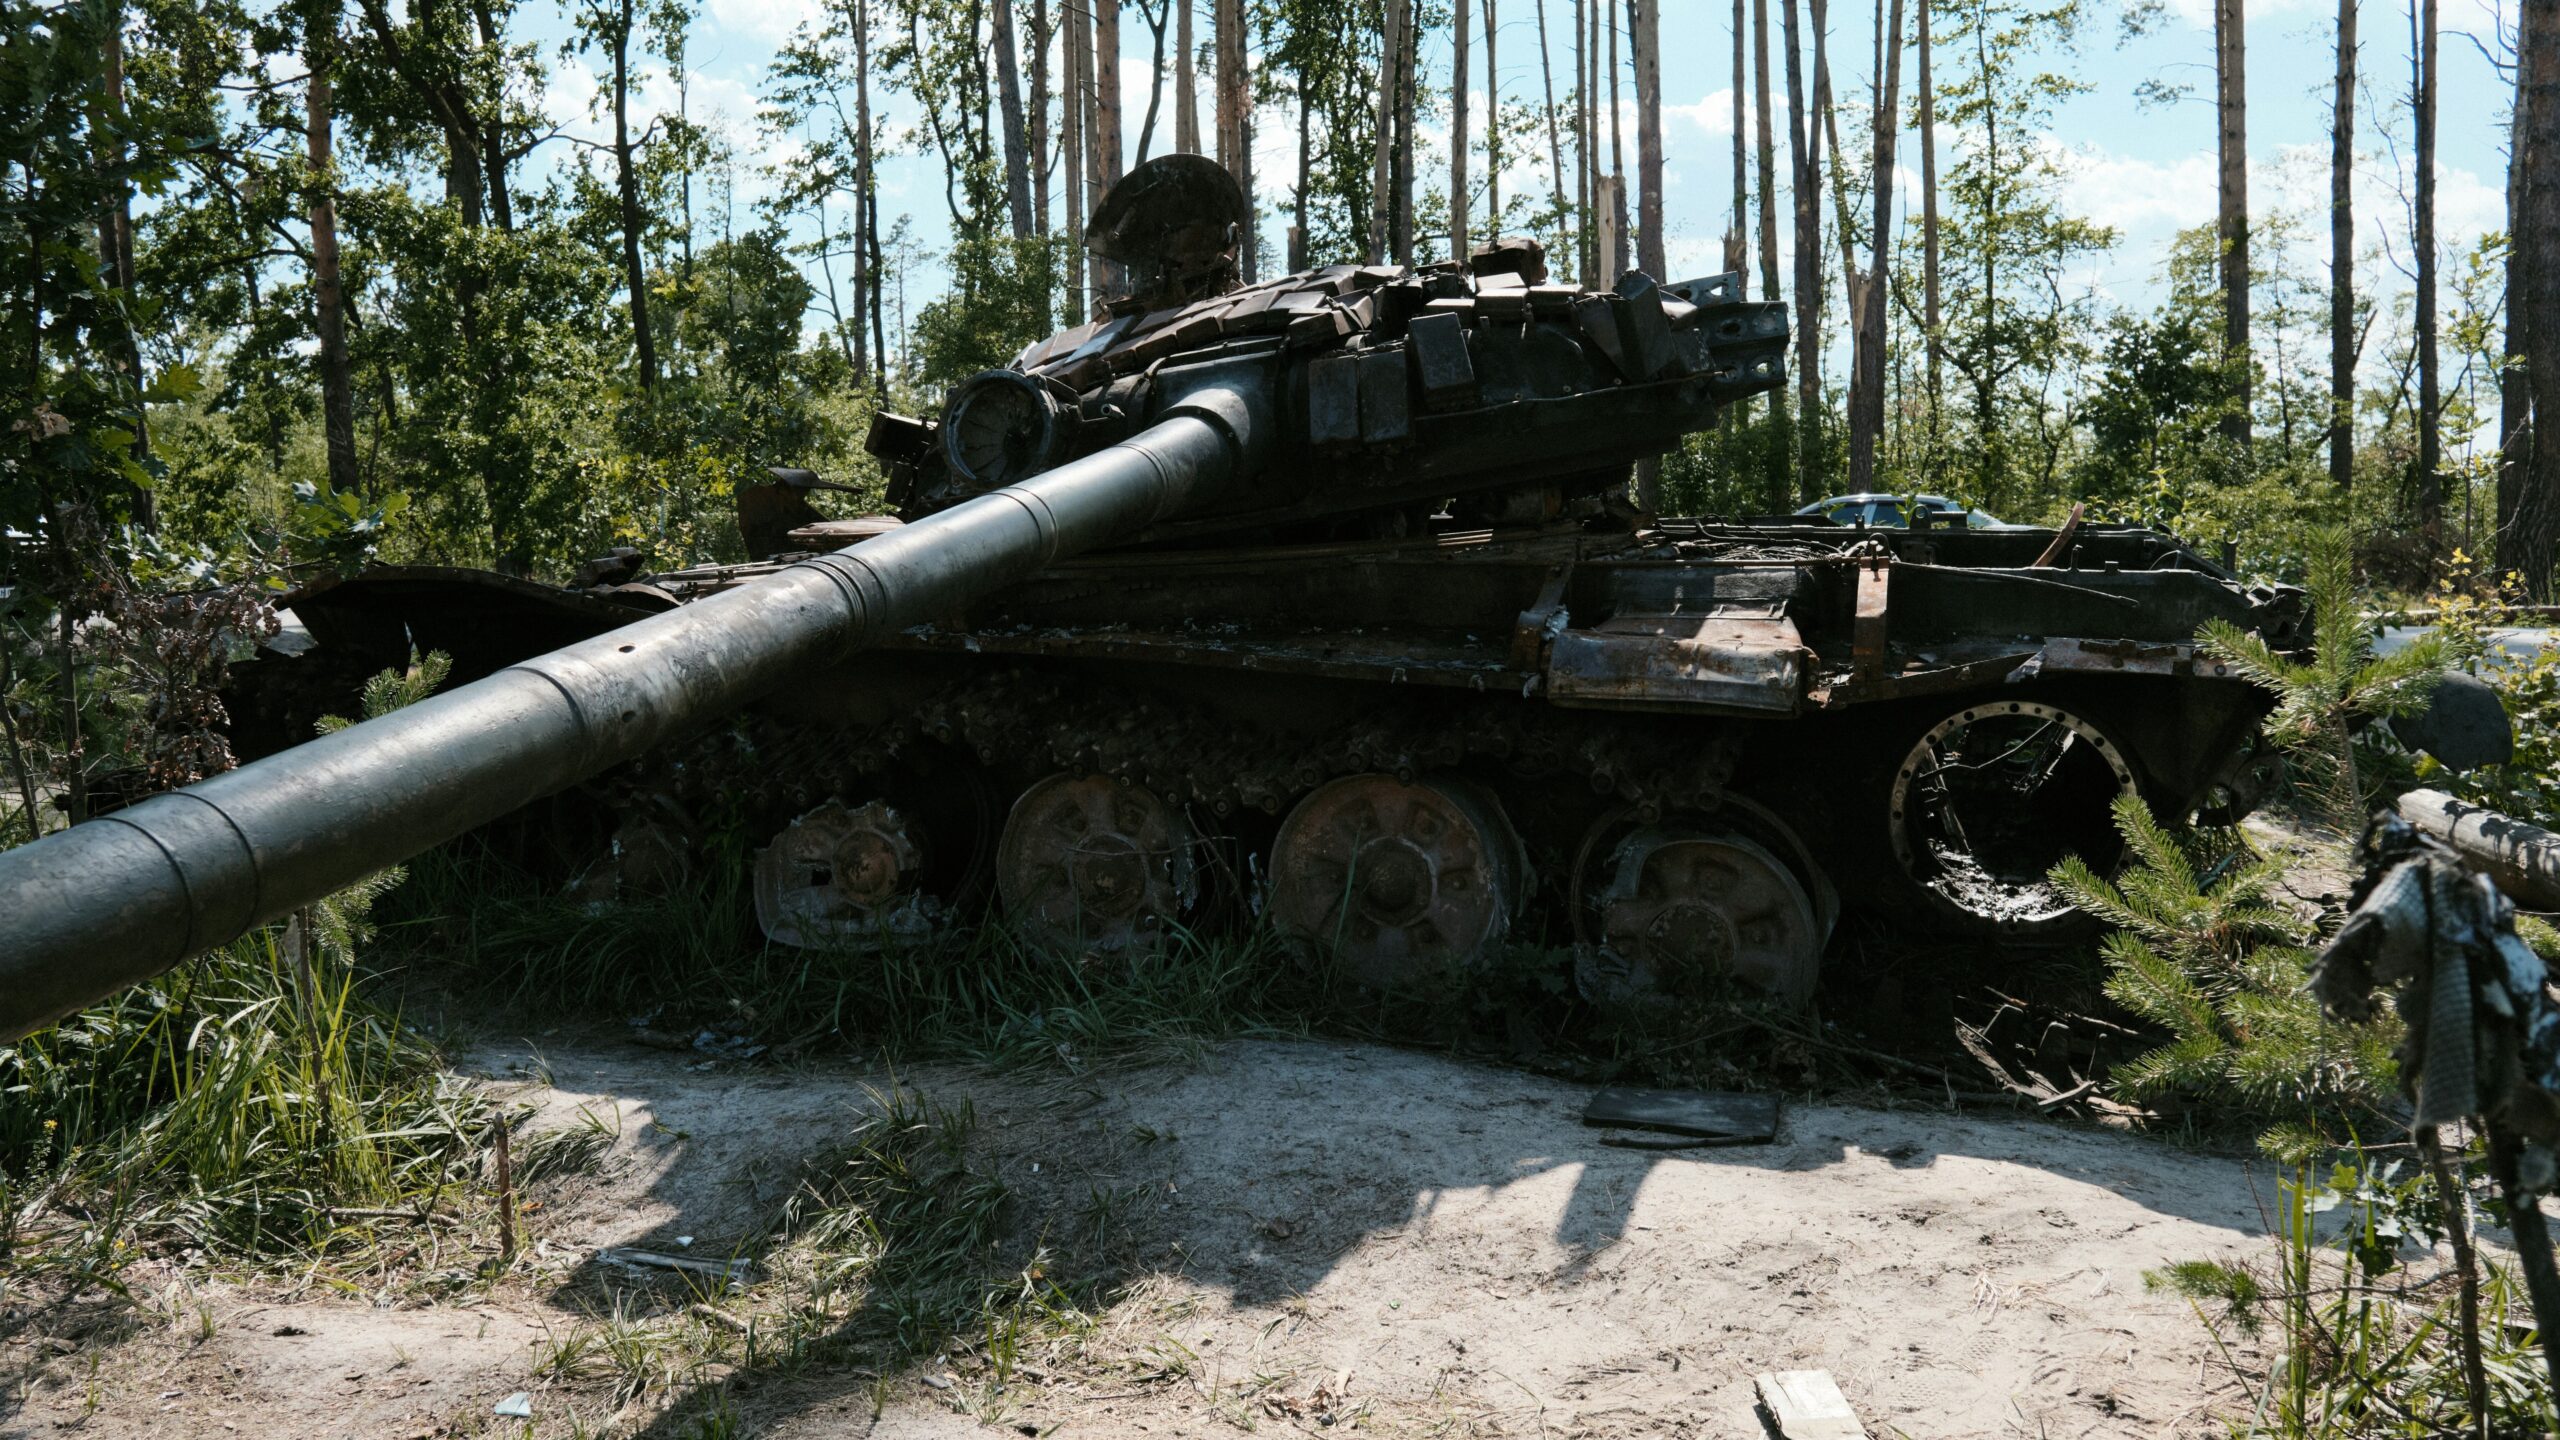
When Russia invaded Ukraine in 2022, the Economist had journalists covering the diplomatic angle and on the ground. But Dr Solstad felt that there was something missing: real-time, interactive data on the fighting. He explained: ‘I figured what would be most interesting to me would be to see the war as it was progressing, to try to do that in real time.’
Around the same time, he saw the development of a satellite tracker for wildfires. Like wildfires, Dr Solstad explained, explosions release large amounts of heat, which can also be seen from space. From that initial realisation, he spent a year processing the data. He recounted the difficulty of understanding patterns from the wildfire data – not least because in a prewar year, there were around 60,000 fires, mostly due to agricultural processes. Through mathematical modelling and scaling, the war tracker manages to process every heat anomaly in Ukraine every day, which, taken with the news coverage, allows readers to understand how fighting is advancing.
Satellite data are not perfect – some fires may be missed if they end before the satellite passes above them, or their view may be obscured by cloud coverage (which the war tracker also maps). Despite these imperfections, the data are precise enough that NGOs working in Ukraine and Sudan have used the satellite data to maximise the efficiency of humanitarian-aid delivery to the areas hit by conflict.
But not all data journalism projects take a year to develop – in fact, the war tracker was an exceptionally long one. Though there is no set structure for how data stories emerge, Dr Solstad described how sometimes he starts from the question, asking himself what information is missing, why it is missing, and what he can do to get it: ‘What is the information that I don’t have that would be most useful for me to share with our readers, that I could possibly get? Part of that is saying well, if I don’t have it, or if no-one has it, is there a good reason for that?’ He then overcomes the data limitations of traditional journalism by sourcing data from a variety of sources and synthesising it to generate new insights.
Other times, the story may be a collaborative project. Dr Solstad explained the process behind his collaboration with Robert Guest, the Economist’s Deputy Editor and former Foreign Correspondent, in their piece about malnourishment among pregnant women and its link to stunted development in their children. The journalists started discussing what they could use to investigate the relationship between developmental heath and cognitive capacities. They wanted to investigate: ‘How are these things related, if they are related, and what kind of data can tell us about that?’
After going into ‘data-hunting mode’, Dr Solstad’s breakthrough came when he found a UNICEF study on the proportion of children who were meeting the developmental thresholds for their age, which gave him the data to examine correlations with rates of anaemia in women of the same countries. The final piece combined the data with fieldwork, illustrating the different causes for the phenomenon and emerging solutions, complete with quotes from Bangladeshi mothers impacted by nutritional deficiencies.
Independently of how the story emerges, Dr Solstad emphasised that he considers it his job to deliver information that is both useful to the reader and told in an engaging way which respects readers’ time and attention. One way of doing so is to present different parts of a phenomenon and how they tie together to explain a concept. Another is to present a case as a thesis that is proven or disproven, which offers a clear structure and takeaways for the reader.
Becoming a Data Journalist
So where can OPR readers inspired by a career in data journalism start? Before giving an answer, Dr Solstad caveats his advice: apart from having started editorial writing since high school, which he credits as having allowed him to keep a foot in journalism, his process to becoming a data journalist was slightly unusual. As he was finishing his doctorate at Princeton University, he received a call from the Economist’s data editor, Dan Rosenheck, who had stumbled across his work and wanted him to apply to an open position on the data team. After going through the application process and interviews, Dr Solstad received and accepted to join the team, starting in February 2020.
Dr Solstad sees his work as a data journalist adjacent to his work as an academic, but with journalisms’ shorter time frames and larger outreach. He describes how he was ‘drawn to the faster time frames, and to having an audience for my works and the ability to impact the decisions of many people, in hopefully a good way. And that is what brought me to London. Worth noting is, the way I see it, my work is very closely related to the work I did as an academic. I use what I learned in college and especially in my dissertation and PhD work every day.’
To aspiring data journalists, he stresses the importance of having a portfolio of strong work and the emphasis on techniques, highlighting that a lot of data journalism is dependent on the same skills that social science students learn in their methods courses, both quantitatively and qualitatively. Furthermore, ‘the quality of your work really matters. Having a portfolio of strong work can be very useful, in part because producing that portfolio will let you acquire the skills to do well in any assignments you get presented with during the application process.’
But beyond hard skills, Dr Solstad emphasised the importance of imagination and creativity, as well as being on the constant look out for new ways of using the data that we have to explain other phenomena. He reminds us: ‘Imagination is really important; being creative and imaginative and having that flexibility in how you think, not going for the most obvious angle; sitting down and thinking deeply about what you want to do.’